# Micron's $54.2B Fiscal Q4: The 8-K Numbers Behind the 379%
> Micron's fiscal Q4 2026 revenue was $54.23B. GAAP vs non-GAAP results, five quarters side by side, FQ1 2027 guidance, and what the 379% actually measures.
Micron Technology reported revenue of $54.23 billion for its fiscal fourth quarter of 2026, the three months ended September 3, 2026, in a [Form 8-K](/glossary/form-8-k/) filed on September 30. GAAP net income was $37.70 billion, or $32.87 per diluted share. For the first quarter of fiscal 2027, Micron guided revenue of $61.5 billion, plus or minus $1.5 billion. The "379%" in several reports is real: it is year-over-year revenue growth. But the quarter it measures was a week longer than the one it is compared with.
## TL;DR
- **Revenue $54.23 billion, up 379% from $11.32 billion a year earlier** (our arithmetic on the filed figures gives 379.3%). Sequential growth was 30.8%, down from 73.7% the quarter before.
- **A 14-week quarter.** Micron's May 10-Q says fiscal 2026 has 53 weeks and its fourth quarter has 14. The year-ago quarter and the May quarter each had 13. The press release does not mention this.
- **Guidance: $61.5 billion ± $1.5 billion** for fiscal Q1 2027, with gross margin of about 85.95% (GAAP) or 86.25% (non-GAAP). Micron's CFO said he anticipates fiscal Q1 to be "the floor for gross margins in fiscal 2027."
## What happened
Micron released its results after the U.S. market close on September 30, 2026. The 8-K, signed by CFO Mark Murphy, reports results under Item 2.02 and attaches the press release as Exhibit 99.1 (listed under Item 9.01). Micron also posted prepared remarks for its conference call on its investor relations site.
CNBC, citing LSEG consensus, put analysts' expectations for the quarter at $51.07 billion in revenue and $31.61 in adjusted earnings per share; Reuters reported the same estimates. For fiscal Q1 2027, Reuters cited an LSEG average of $57.02 billion in revenue and estimates of $35.40 in adjusted EPS. Those are analysts' numbers, not Micron's.
Micron's own June guidance for this quarter was $50.0 billion ± $1.0 billion in revenue and $30.73 ± $1.00 in GAAP diluted EPS. Actual revenue came in $3.23 billion above the top of that range (our arithmetic). The prepared remarks say revenue, gross margin and EPS each exceeded "the high end of our guidance."
## What the release says: five quarters side by side
Headlines give one quarter. The filed releases give enough to line up five. All figures below come from Micron's Exhibit 99.1 releases for each quarter. Net capex is Micron's non-GAAP "investments in capital expenditures, net," which nets out government incentives and asset-sale proceeds.
| | FQ4 2025 | FQ1 2026 | FQ2 2026 | FQ3 2026 | FQ4 2026 |
|---|---|---|---|---|---|
| Quarter ended | Aug 28, 2025 | Nov 27, 2025 | Feb 26, 2026 | May 28, 2026 | Sep 3, 2026 |
| Weeks | 13 | 13 | 13 | 13 | **14** |
| Revenue | $11.32B | $13.64B | $23.86B | $41.46B | $54.23B |
| Change vs prior quarter | | +20.6% | +74.9% | +73.7% | +30.8% |
| Gross margin, GAAP | 44.7% | 56.0% | 74.4% | 84.6% | 86.8% |
| Gross margin, non-GAAP | 45.7% | 56.8% | 74.9% | 84.9% | 87.0% |
| Net income, GAAP | $3.20B | $5.24B | $13.79B | $28.24B | $37.70B |
| Diluted EPS, GAAP | $2.83 | $4.60 | $12.07 | $24.67 | $32.87 |
| Diluted EPS, non-GAAP | $3.03 | $4.78 | $12.20 | $25.11 | $33.42 |
| Operating cash flow | $5.73B | $8.41B | $11.90B | $25.39B | $43.97B |
| Net capex | $4.93B | $4.5B | $5.0B | $7.1B | $10.77B |
Sources: Micron Exhibit 99.1 releases (Sept 23, 2025; Dec 17, 2025; Mar 18, 2026; Jun 24, 2026; Sept 30, 2026). Week counts from the May 2026 10-Q; FQ1–FQ3 and FQ4 2025 are 91 days each by their dates. Quarter-on-quarter changes are our arithmetic.
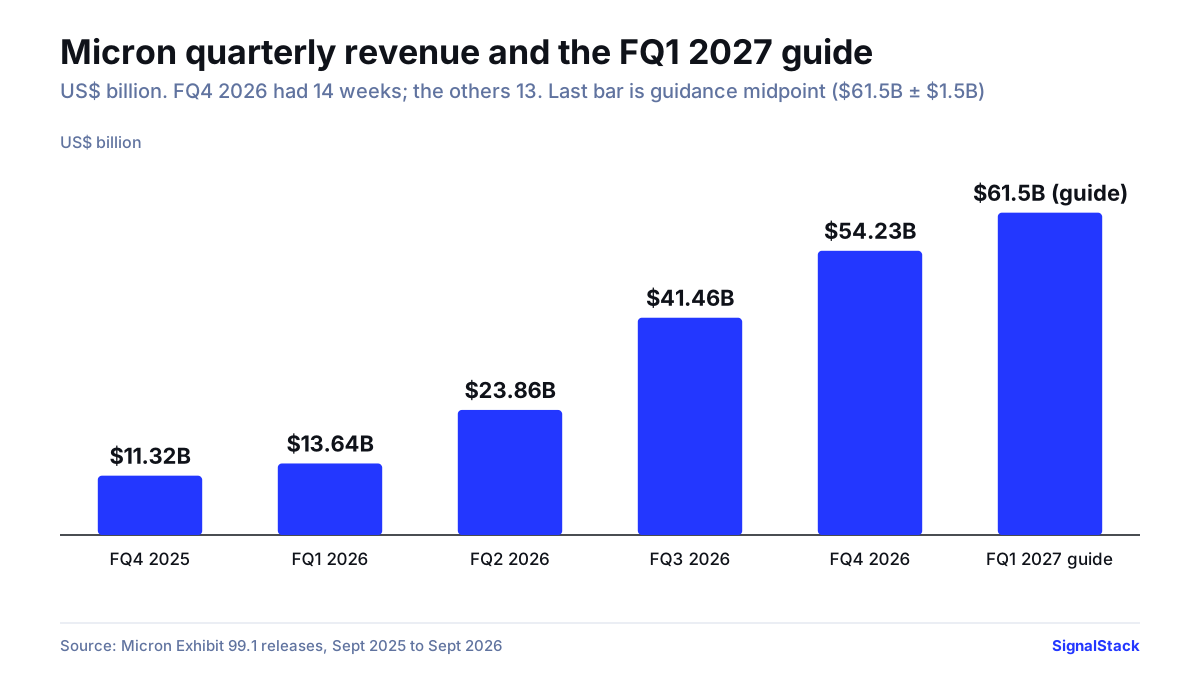
Revenue rose in each of the last five reported quarters; the last bar is Micron's guidance midpoint, not a result. Source: Micron Exhibit 99.1 releases, Sept 2025 to Sept 2026.
### GAAP and non-GAAP are close, except for one charge
The non-GAAP adjustments in fiscal Q4 added $697 million to net income (our arithmetic: $38.40 billion minus $37.70 billion). The reconciliation lists $364 million of stock-based compensation and a $500 million patent license charge. Smaller items and a $198 million tax effect make up the rest. The release does not say what the patent license covers. GAAP operating expenses rose to $3.30 billion from $1.74 billion in fiscal Q3. Micron's prepared remarks attribute the rise in non-GAAP operating expenses mostly to higher incentive pay for every employee and a $300 million contribution to community investments.
## What exactly grew 379%?
Revenue. $54,229 million against $11,315 million is a 379.3% increase, and Micron's prepared remarks say "up 379% year over year." Other year-over-year changes in the same quarter, all our arithmetic on filed figures:
- GAAP net income: +1,078%
- GAAP diluted EPS: +1,061%; non-GAAP diluted EPS: +1,003%
- Operating cash flow: +667%
- DRAM revenue: +343% to $39.8 billion; NAND revenue: +526% to $14.1 billion (Micron's prepared remarks)
At least one crypto-news flash, from KuCoin, tied the 379% to "$43.97 billion in operating cash flow." That pairing is wrong. $43.97 billion is operating cash flow, which rose about 667%. The 379% belongs to the $54.23 billion revenue figure.
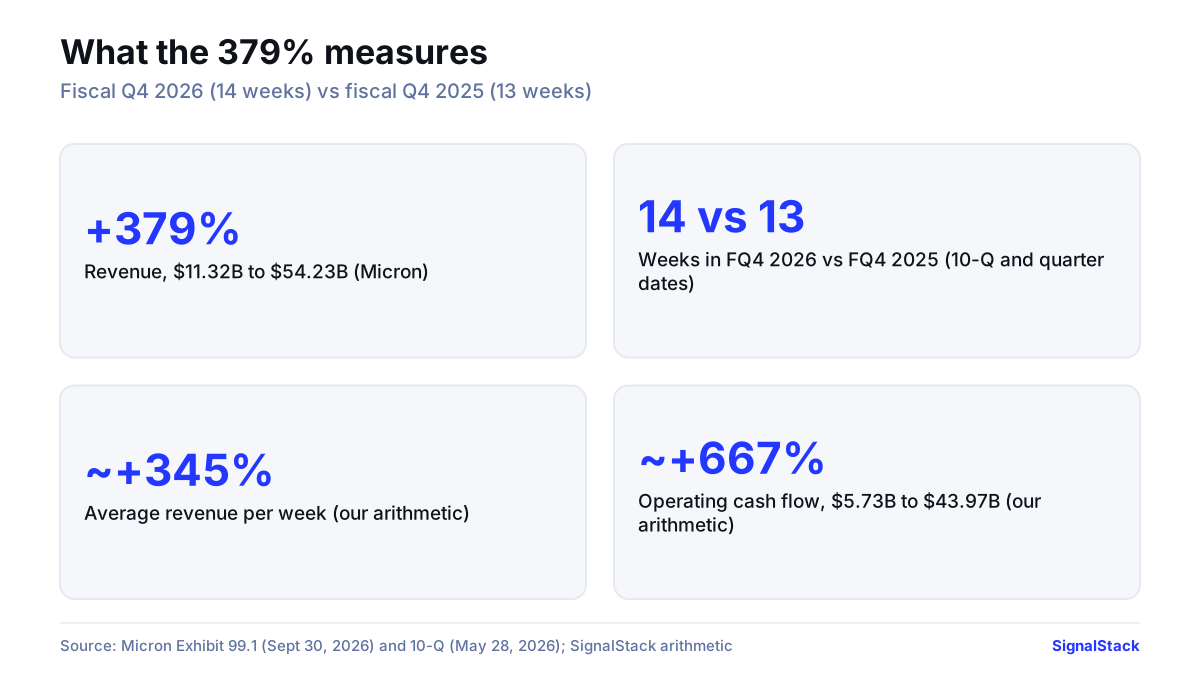
**The extra week.** The 10-Q states that the fourth quarter of fiscal 2026 contains 14 weeks. Neither the release nor the prepared remarks adjusts for it. Dividing each quarter's revenue by its weeks gives about $3.87 billion a week, against $0.87 billion a year earlier. That is a 345% increase, not 379%. Against fiscal Q3, the weekly figure rose about 21%, not 31%. This is our arithmetic, and it assumes sales were spread evenly across each quarter. Micron does not report weekly revenue.
The 379% is revenue growth over a 14-week quarter compared with a 13-week one. Source: Micron Exhibit 99.1 (Sept 30, 2026) and 10-Q (May 28, 2026); SignalStack arithmetic.
## Business units: where the revenue came from
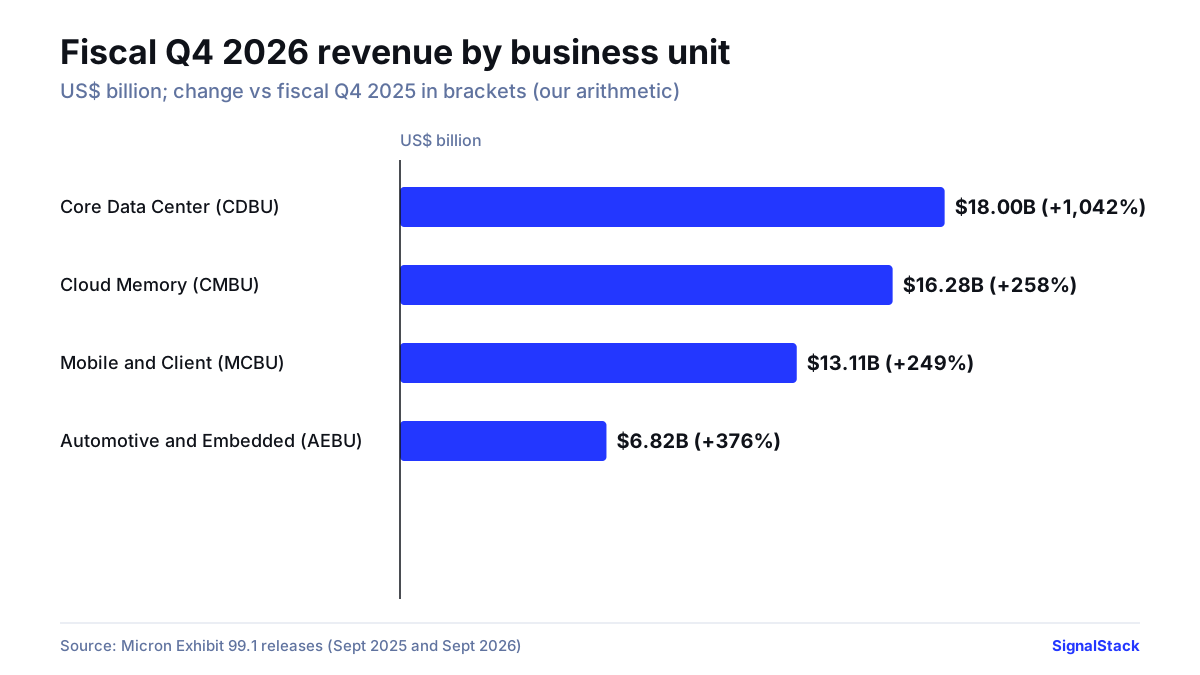
Micron reports four business units. Core Data Center (CDBU) became the largest this quarter.
| Business unit | FQ4 2026 revenue | vs FQ3 2026 | vs FQ4 2025 | Gross margin FQ4 2026 |
|---|---|---|---|---|
| Core Data Center (CDBU) | $18.00B | +56% | +1,042% | 90% |
| Cloud Memory (CMBU) | $16.28B | +18% | +258% | 83% |
| Mobile and Client (MCBU) | $13.11B | +14% | +249% | 90% |
| Automotive and Embedded (AEBU) | $6.82B | +47% | +376% | 84% |
Sources: Micron Exhibit 99.1 releases (Sept 23, 2025; Jun 24, 2026; Sept 30, 2026). Percentage changes are our arithmetic.
Core Data Center revenue was $1.58 billion a year earlier and $18.00 billion in fiscal Q4 2026. Source: Micron Exhibit 99.1 releases (Sept 2025 and Sept 2026).
### What Micron says about HBM
Micron gives no dollar figure for [HBM](/glossary/hbm/) this quarter. Its prepared remarks make four statements:
- HBM revenue in fiscal Q4 "grew faster than total company revenue."
- Agreements cover "the vast majority" of Micron's calendar 2027 HBM bit supply, at prices up significantly from a year earlier. Micron says this narrows the gross-margin gap with conventional DRAM.
- Cloud Memory gross margin was flat at 83% because higher pricing was offset by a higher HBM mix.
- Micron is working with Nvidia on what it calls the industry's first custom HBM4E, named NVHBM. Its Singapore HBM packaging facility expects initial output in early calendar 2027.
In June, Micron's remarks said it had already shipped over $1 billion in HBM4 revenue. CNBC notes that Micron holds the smallest HBM market share of the three main suppliers, behind SK hynix and Samsung.
## Guidance for fiscal Q1 2027, as Micron states it
| FQ1 2027 outlook | GAAP | Non-GAAP |
|---|---|---|
| Revenue | $61.5B ± $1.5B | $61.5B ± $1.5B |
| Gross margin | Approximately 85.95% | Approximately 86.25% |
| Operating expenses | Approximately $2.31B | Approximately $2.06B |
| Diluted EPS | $37.84 ± $1.00 | $38.15 ± $1.00 |
Source: Micron Exhibit 99.1, Business Outlook and reconciliation (Sept 30, 2026). EPS assumes about 1.15 billion diluted shares.
The revenue midpoint is 13.4% above fiscal Q4 revenue (our arithmetic). The non-GAAP gross margin guide is lower than fiscal Q4's 87.0%. Murphy said most of the added fiscal 2026 incentive pay tied to manufacturing was absorbed into inventory in fiscal Q4, and that selling that higher-cost inventory mainly affects fiscal Q1 gross margin. He also said Micron expects fiscal 2027 to be "another record year, with sequential revenue growth each quarter."
On spending, Micron projects about $11.5 billion of net capex in fiscal Q1 and about $25 billion in the first half of fiscal 2027, with more in the second half. Fiscal 2026 net capex was $27.37 billion.
## Background: the customer agreements behind the balance sheet
Micron's strategic customer agreements (SCAs) are multi-year take-or-pay contracts, according to the May 10-Q. The fiscal Q4 filings and remarks show how fast they have grown:
- **Count:** 16 SCAs in June; 26 now. Micron estimates they will account for over 35% of its revenue through 2030.
- **Commitments:** customer financial commitments of $32 billion, up from a projected $22 billion in June, "the vast majority" in cash deposits.
- **Contract liabilities on the balance sheet:** noncurrent customer contract liabilities were $12.90 billion at September 3, against $568 million at May 28. Micron puts customer cash deposits on its balance sheet at $12.7 billion at the end of fiscal Q4. The cash flow statement shows $12.75 billion of deposits received in fiscal 2026, booked as financing cash flow, not operating cash flow.
- **Remaining performance obligations:** about $150 billion, against about $100 billion cited in June for the SCAs signed by then. Micron says this figure counts only SCAs with fixed or floor-and-ceiling pricing, at minimum prices.
Micron's 10-Q risk factors also warn that AI-driven demand for HBM "may fluctuate." For context on the memory supply race, see our report on [SK hynix's Japan fab, Chongqing sale and Solidigm filings](/blog/sk-hynix-japan-fab-chongqing-solidigm-ipo-filings/). For Micron's filed quarters, see [Micron earnings](/earnings/micron/), the [Micron company hub](/company/micron/) and [Micron insider filings](/insiders/micron/). More coverage: [AI & Semiconductors](/category/ai-chips/).
## What could go right / What could go wrong
**What could go right**
- The SCAs add take-or-pay volumes and $32 billion of customer commitments, which Micron says improve the predictability of its results.
- Micron says HBM supply for calendar 2027 is mostly contracted at higher prices, narrowing HBM's margin gap with conventional DRAM.
- Micron expects memory supply to stay tight through calendar 2028 and says it has no line of sight to when supply and demand will balance.
**What could go wrong**
- The 10-Q says the long-term trajectory of AI-driven HBM demand "is unknown," and that if HBM demand weakens and suppliers shift capacity to conventional DRAM, oversupply could pressure prices.
- A quarter of the revenue Micron expects from SCAs is priced periodically at market rates, so it has no fixed price or band.
- Capex is rising: Micron plans about $25 billion for the first half of fiscal 2027, against $27.37 billion for all of fiscal 2026.
- Comparisons with fiscal Q4 2026 include an extra week, which the release does not adjust for.
## FAQ
Q What was Micron's revenue for fiscal Q4 2026?
A $54.23 billion for the quarter ended September 3, 2026, against $41.46 billion in fiscal Q3 and $11.32 billion a year earlier. GAAP net income was $37.70 billion, or $32.87 per diluted share.
Q What does Micron's 379% figure refer to?
A Year-over-year revenue growth in fiscal Q4 2026, from $11.32 billion to $54.23 billion. That quarter had 14 weeks against 13 a year earlier, per Micron's 10-Q.
Q What is Micron's guidance for fiscal Q1 2027?
A Revenue of $61.5 billion ± $1.5 billion, gross margin of about 85.95% GAAP or 86.25% non-GAAP, and diluted EPS of $37.84 ± $1.00 GAAP or $38.15 ± $1.00 non-GAAP.
Q How much HBM revenue did Micron report?
A Micron did not disclose an HBM dollar figure for fiscal Q4. It said HBM revenue grew faster than total revenue and that most of its calendar 2027 HBM bit supply is under agreement.
Q What are Micron's strategic customer agreements?
A Multi-year take-or-pay supply contracts. Micron has signed 26, with $32 billion in customer financial commitments, mostly cash deposits, and remaining performance obligations of about $150 billion.